COVID Impact dashboard
Why use this feature
COVID Impact is a collection of reports with Axiom Intelligence visualizations that enable users to analyze how COVID-19 is affecting their institutions, from both cost and utilization aspects. In addition, information about COVID patients include demographic and geographic information, details of treatments for each patient encounter, and payor information. The data presented can help the institution analyze their current handling of COVID encounters and provide data for planning.
Click image to view full size
The reports are:
-
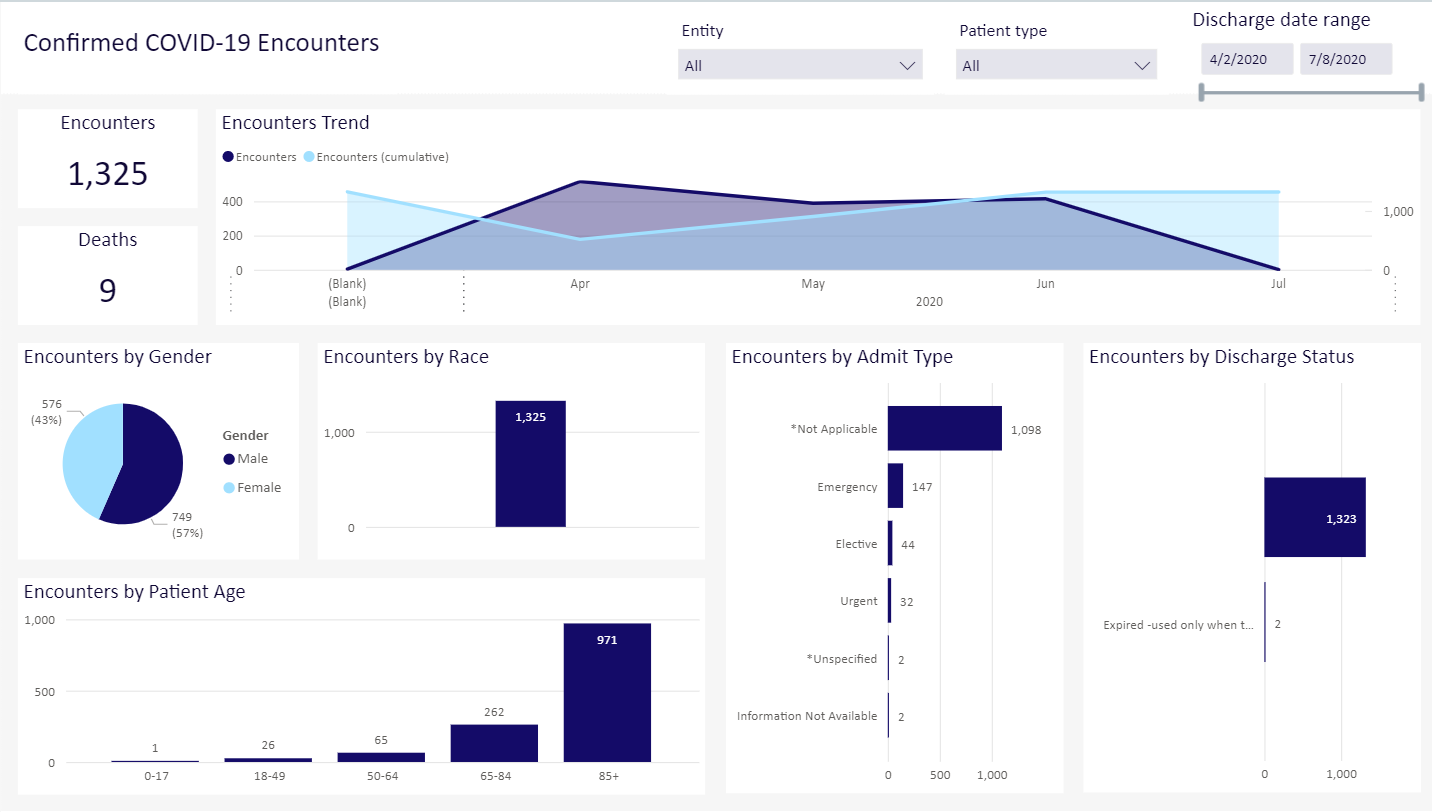
Confirmed COVID-19 Encounters, which provides patient demographic information and shows encounter trends over time.
-
COVID-19 Geography, which provides an interactive map of the United States showing the locations and relative size of COVID encounters. Users can view data by state, county, or ZIP code, aiding in the identification of COVID clusters.
-
Utilization, which examines encounters by total cost range, cost per case by specialty groups, and usage and costs. Costs are broken down by individual items used by the institution for its COVID encounters.
-
Encounter Detail, which lists all COVID encounters with a high-level summary and links to view the full encounter detail for the individual patient. Encounter details include summary of their stay, demographics, groupings the patient belongs to, ICD codes and description for all diagnoses, all providers who treated the patient, financial details, payor types, and surgeries.
-
Financials, which shows costs for DRGs, net income by financial class, and costs per encounter.
How this feature works
What: You view a dashboard and use slicers and built-in dashboard tools to select the exact entities, service lines, date ranges, and other data elements to select the precise data you want to work with.
Where: From the Enterprise Decision Support home page, in the Reporting section, click Intelligence Center. From the Intelligence Center, click Enterprise Decision Support, then click Standard Dashboards, then COVID Impact
Who: Users assigned the EDS User role profile.
How: Use slicers and other dashboard tools to specify the entities, service lines, and other data types to view the needed subset of the data on each dashboard.
TIP: To use this feature, we recommend that you read all of the associated online help topics listed in the "Where to find more information" section below.
Where to find more information
The following topics in the online help have been added or updated with information and instructions for using this feature:
